← Back to Projects
Restaurant Sales Analytics Dashboard
Restaurant KPIs & Insights
Python
SQLite
APIs
Power BI
Project Overview
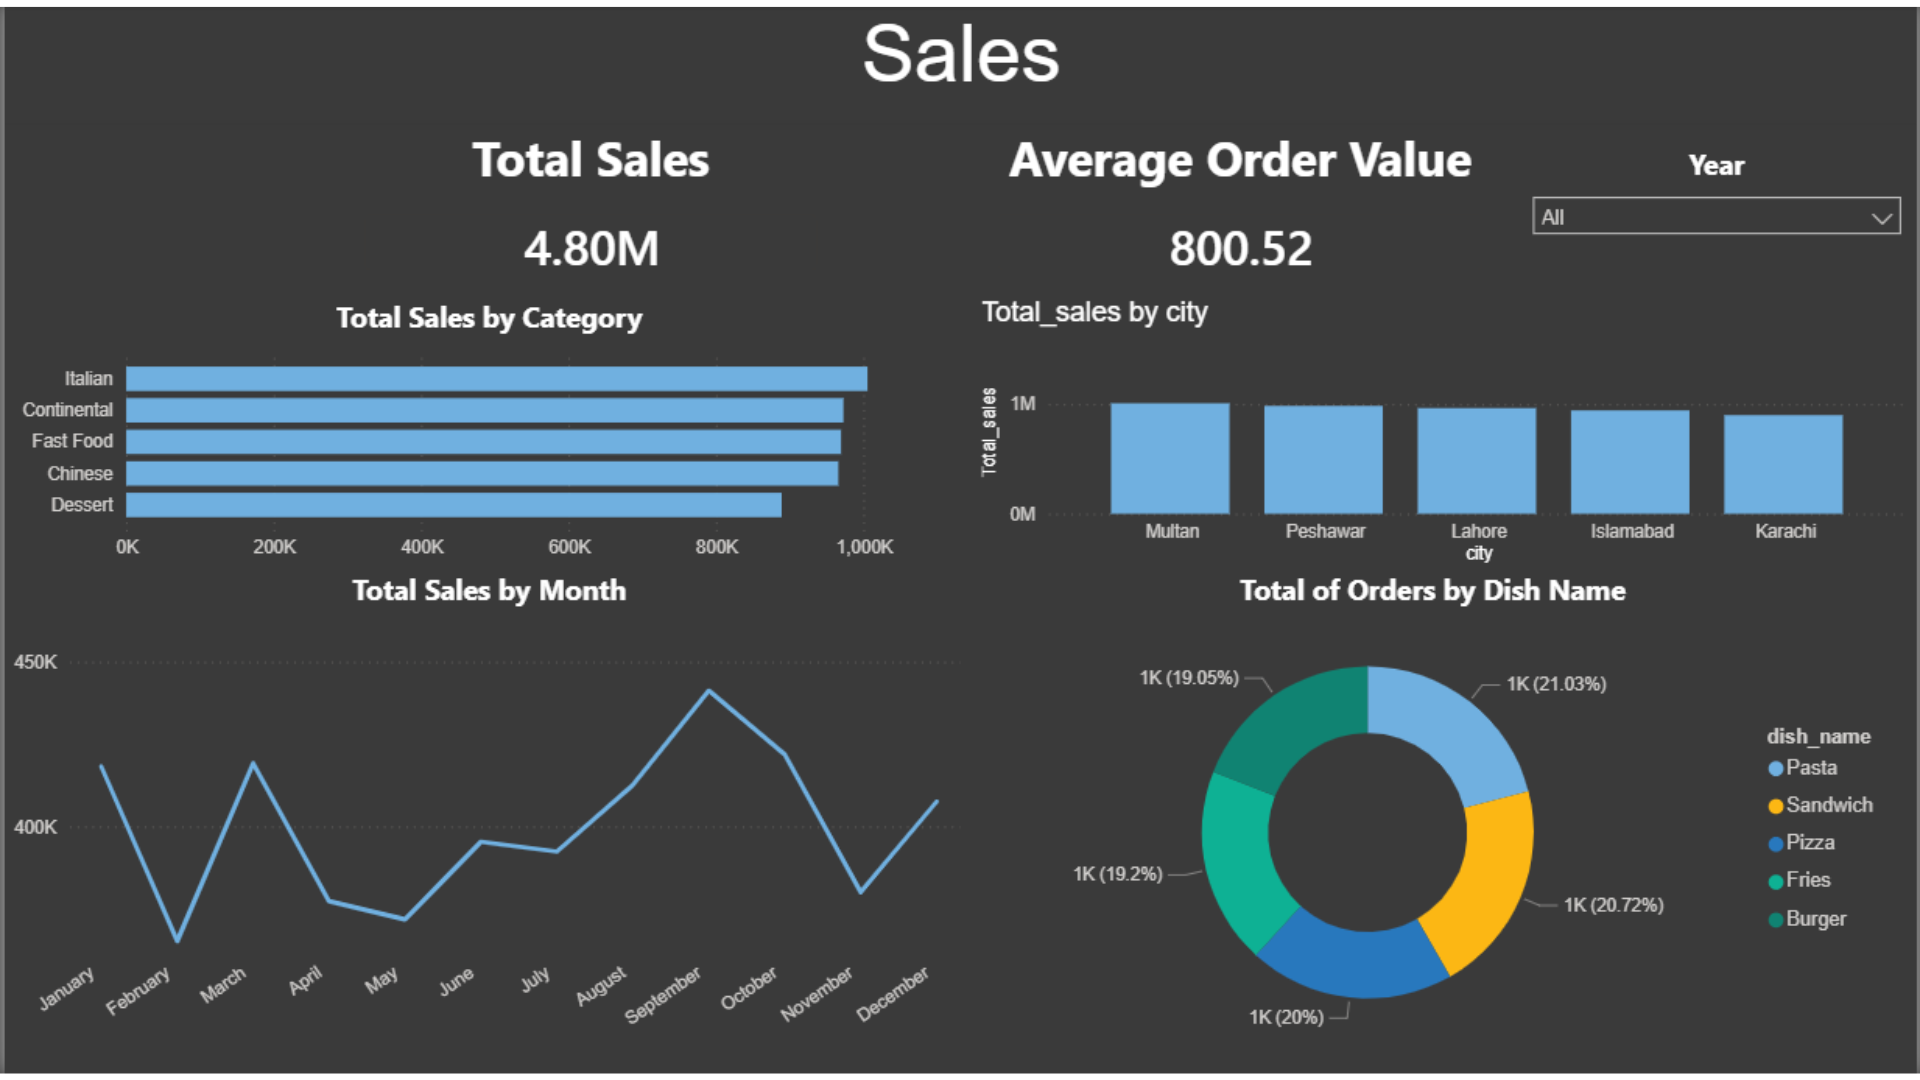
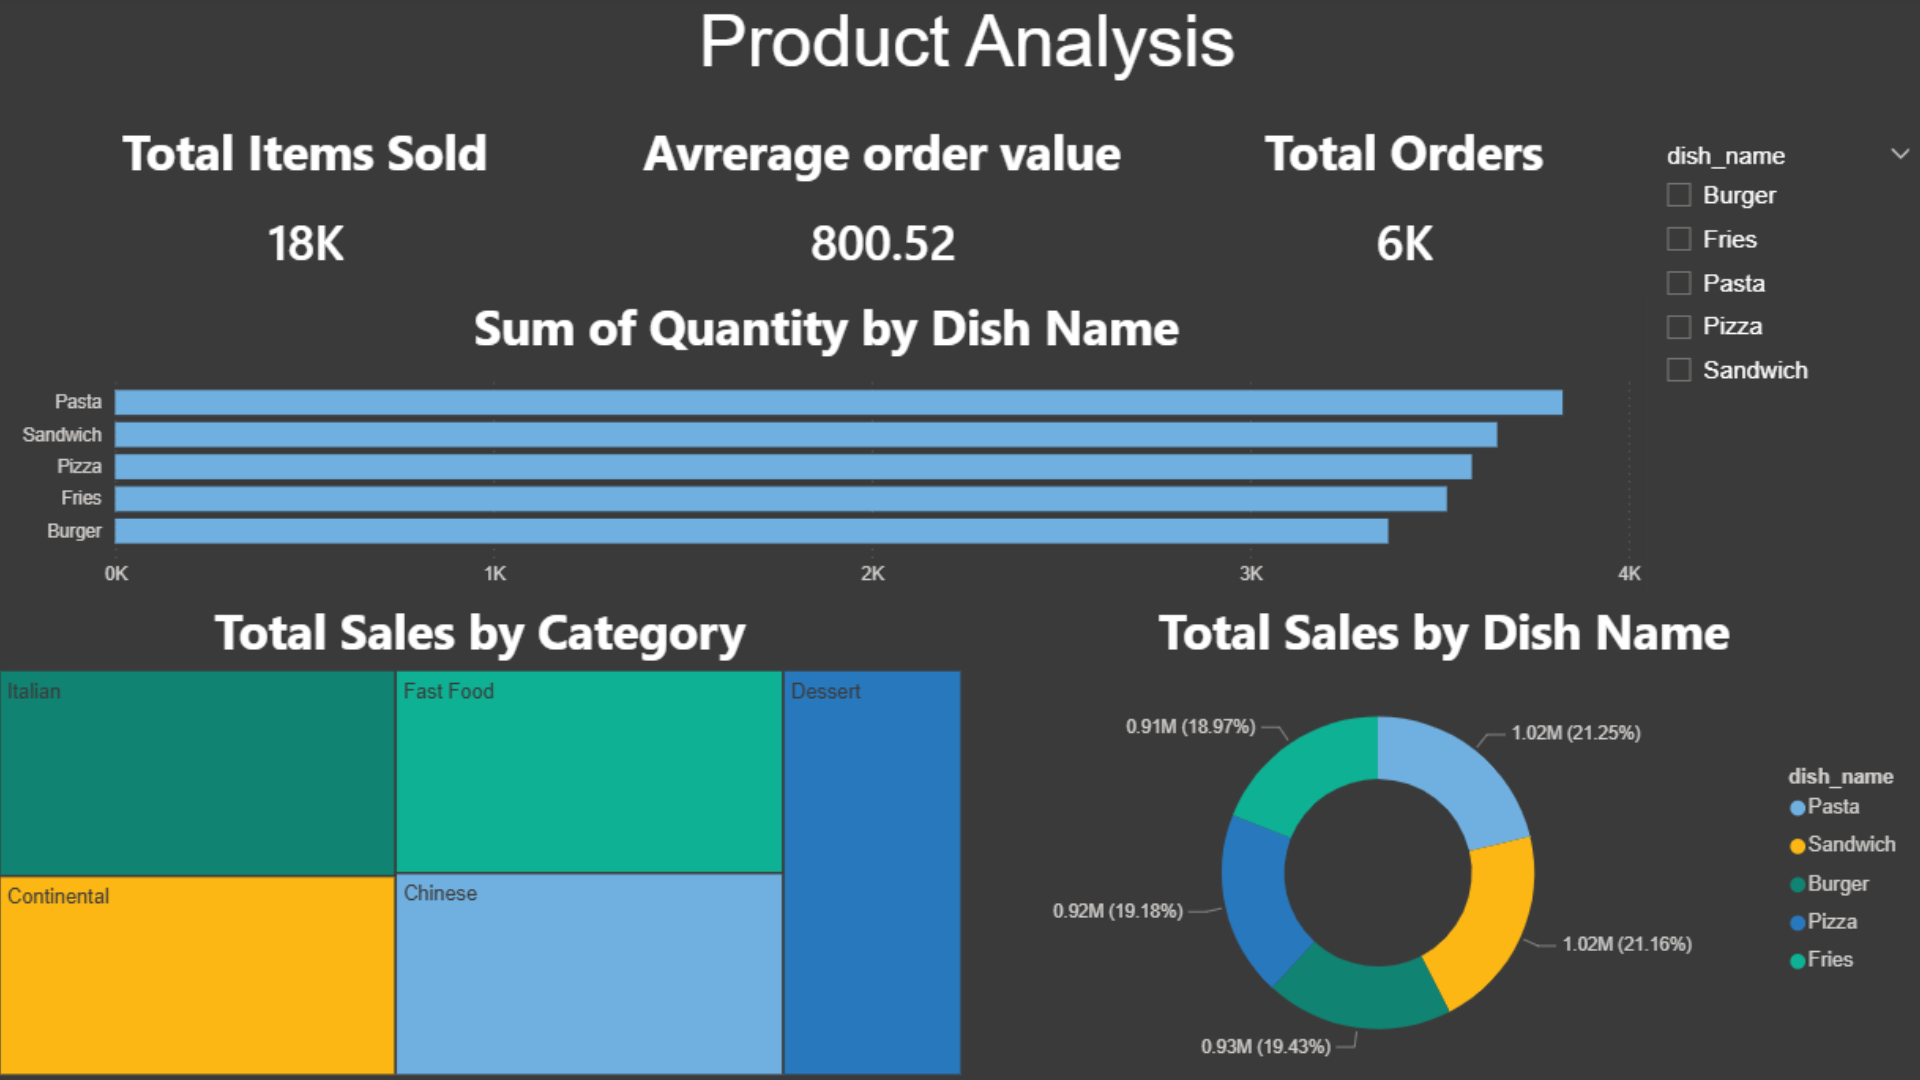
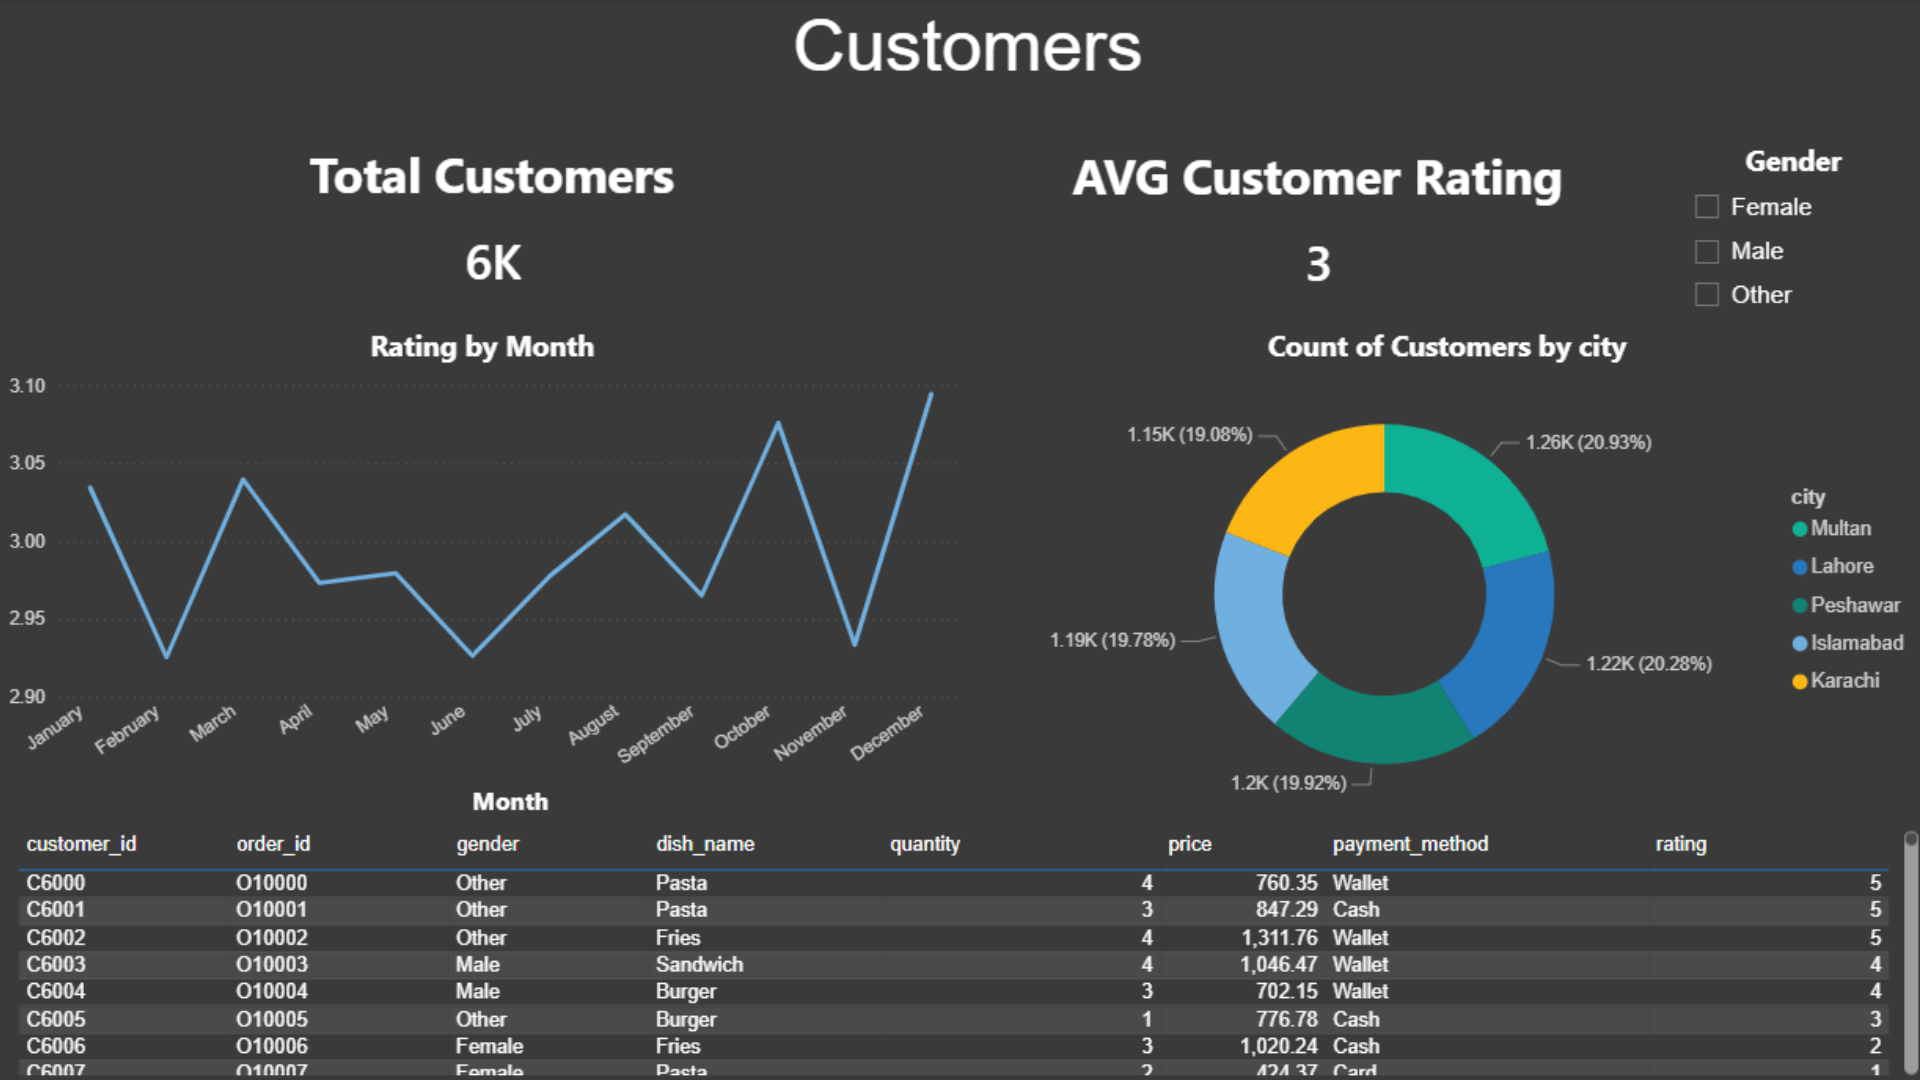
This analytics dashboard focuses on evaluating restaurant performance by systematically tracking core operational KPIs—Total Sales Volume, Average Order Value (AOV), and temporal/seasonal demand cycles.
Technical Workflow & Implementation:
- Data Ingestion via APIs: Leveraged Python to pull live point-of-sale data from external APIs, structuring the JSON outputs into a relational format.
- Database Storage: Designed and maintained a centralized SQLite database to store transactional historical data for querying and trend analysis.
- Dashboard Creation: Built an expansive Power BI interface that correlates menu item popularity with city-level performance, allowing owners to identify exactly which dishes drive revenue in localized markets.
By transforming raw transaction logs into visual narratives, this project empowered restaurant management to optimize menu pricing, forecast supply chain needs more accurately, and reduce ingredient waste during off-peak hours.
View Source Code on GitHub →