← Back to Projects
Sales & Profit Performance Dashboard
Business Performance Analytics
Python
SQL
Power BI
Project Overview
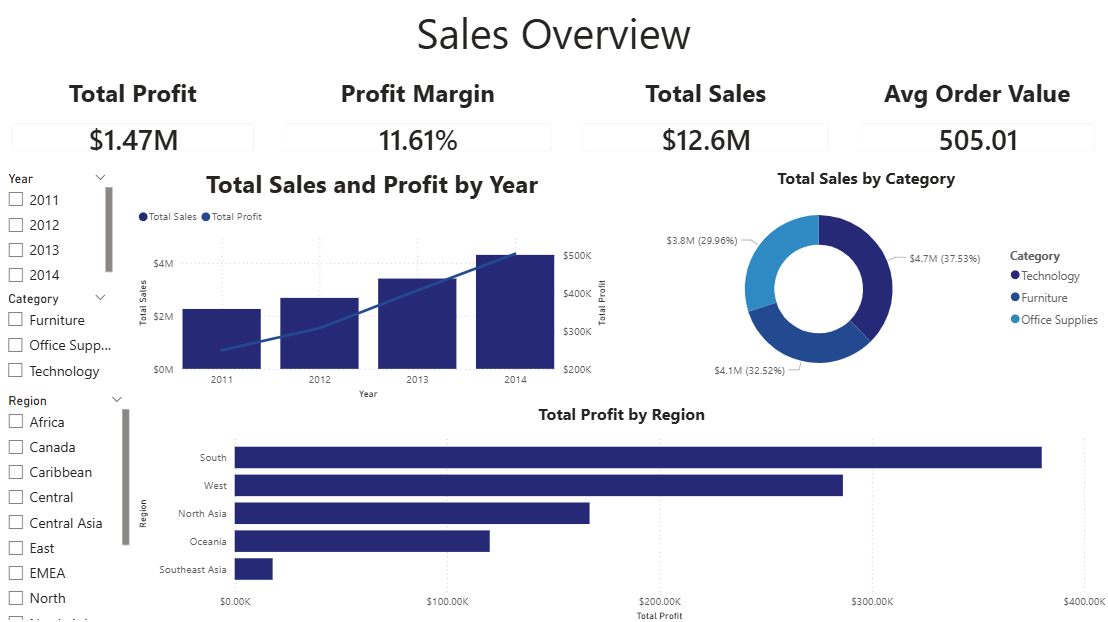
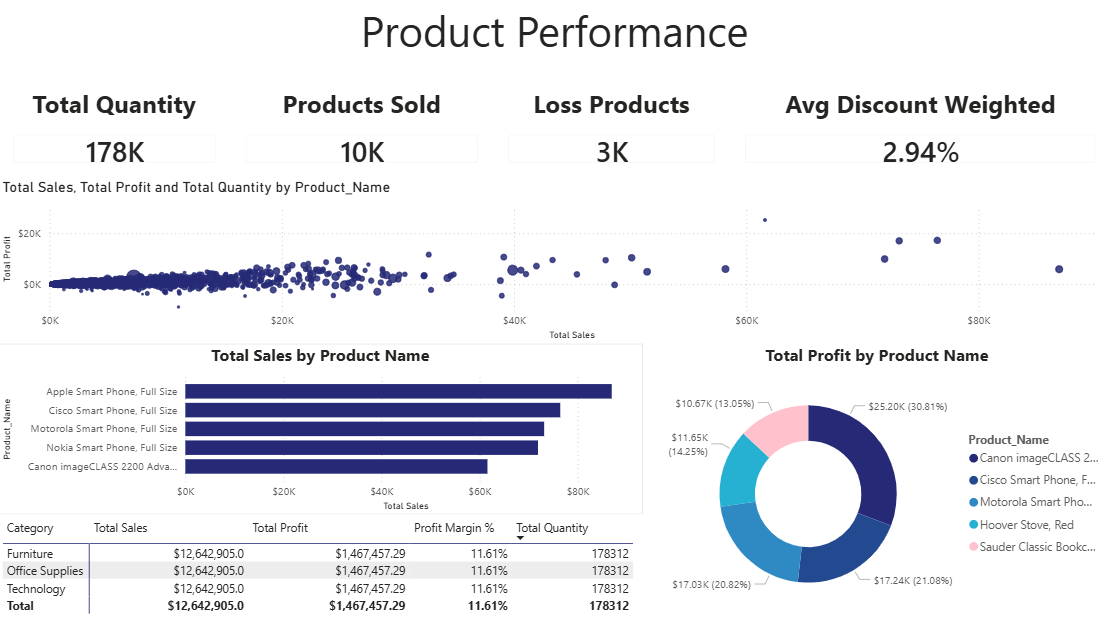
This comprehensive dashboard aims to provide deep, actionable insights into sales operations and profitability metrics across multiple regions and product categories. It serves as a central hub for business leaders to monitor the overall health of the enterprise.
Key Objectives & Methodology:
- Data Extraction & Processing: Processed and cleaned raw sales datasets using Python (Pandas) to handle missing values and standardize formats, ensuring high data quality before modeling.
- Relational Modeling: Utilized SQL to build robust data models and execute complex queries calculating essential KPIs like profit margins, cost of goods sold, and regional revenue distribution.
- Interactive Visualization: Designed a dynamic, interactive Power BI dashboard structured to allow stakeholders to seamlessly drill down from high-level summaries to specialized, granular category views.
The successful deployment of this dashboard streamlined previous reporting workflows, significantly cutting down the time required to compile monthly performance updates and enabling real-time, data-driven strategy formulation.
View Source Code on GitHub →